Manufacturing Sector - November 2012
Business Survey of the Manufacturing Sector in the Milan Area.
In November 2012 manufacturing confidence in the Milan area rebounded a little without, however, recovering the loss of October.
In detail
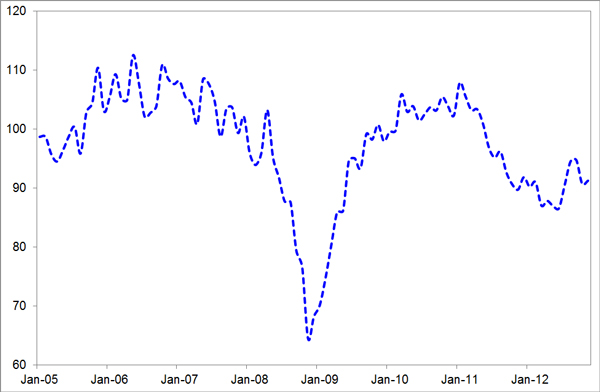
The confidence climate index moved from 90.7 in October to 91.3 in November. The slight increase of the indicator was due to an improvement in production expectations, that showed a value just above zero, and to a drawdown in stock levels, which backed on a negative balance. In countertrend, domestic and foreing orders shrank further, worsening their negative balance.
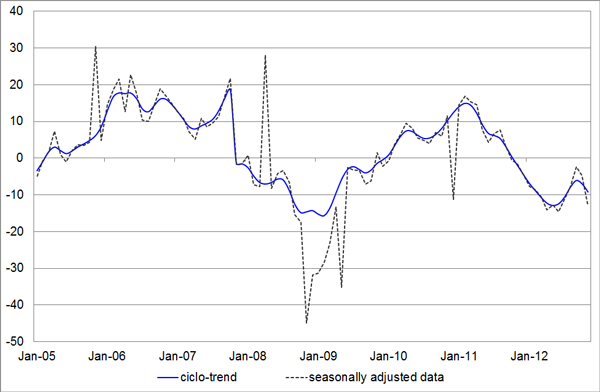
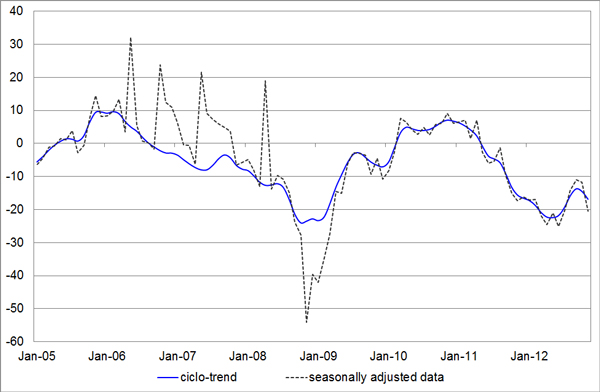
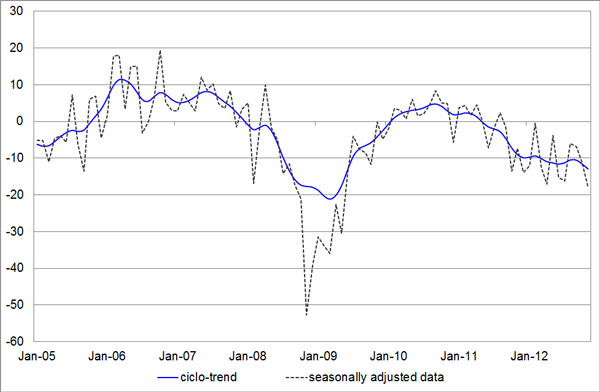
In terms of assessments, industrial production nosedived, marking the lowest value since July 2012. Foreign turnover went down, reaching the minimum since the end of 2009, so did the domestic one that backed on the value of June 2012. Employment rose on the September levels, while maintaining a negative balance.
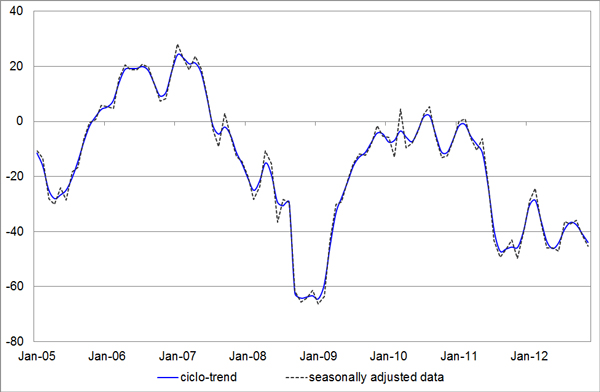
With reference to forecasts for the next 3-4 months, foreign orders expectations enhanced, strengthening their positive balance and peaking since May 2011. On the contrary, national orders expectations which were in downward motion and with a negative balance, lost the small recovery of the previous month.
Finally, opinions about the Italian economic situation worsened, stressing their already seriously negative balance.
1. Graphs
Graph 1 - Confidence climate
Graph 2 - Production assessment
Graph 3 - Assessment on domestic orders
Graph 4 - Assessment on foreign orders
Graph 5 - Inventories

Graph 6 - Production expectation
2. Data
Table 1 - Confidence climate1
| Reference period | Index (2005=100) |
| August-12 | 94.6 |
| September-12 | 94.8 |
| October-12 | 90.7 |
| November-12 | 91.3 |
1 The industrial confidence indicator is the arithmetic average of the seasonally adjusted data on production expectations, order books and stocks of finished products (with inverted sign). The index base is 2005=100.
Table 2 - Production
| Reference period | Assessment seasonally adj. data |
Assessment raw data |
Expectation seasonally adj. data |
Expectation |
| August-12 | -8 | -71 | 3 | 7 |
| September-12 | -2 | 41 | -2 | -8 |
| October-12 | -5 | 6 | -5 | -20 |
| November-12 | -13 | -30 | 1 | -11 |
Table 3 - Domestic orders
| Reference period | Assessment seasonally adj. data |
Assessment raw data |
Expectation seasonally adj. data |
Expectation |
| August-12 | -14 | -68 | -7 | -3 |
| September-12 | -11 | 25 | -11 | -14 |
| October-12 | -12 | -2 | -8 | -21 |
| November-12 | -20 | -37 | -10 | -20 |
Table 4 - Foreign orders
| Reference period | Assessment seasonally adj. data |
Assessment raw data |
Expectation seasonally adj. data |
Expectation |
| August-12 | -6 | -58 | 3 | 5 |
| September-12 | -7 | 23 | -6 | -10 |
| October-12 | -11 | -4 | 1 | -9 |
| November-12 | -18 | -26 | 8 | -2 |
Table 5 - Domestic turnover
| Reference period | Assessment seasonally adj. data |
Assessment raw data |
| August-12 | -13 | -71 |
| September-12 | -6 | 31 |
| October-12 | -11 | -5 |
| November-12 | -18 | -30 |
Table 6 - Foreign turnover
| Reference period | Assessment seasonally adj. data |
Assessment raw data |
| August-12 | -2 | -59 |
| September-12 | -3 | 33 |
| October-12 | -2 | 8 |
| November-12 | -16 | -28 |
Table 7 - Other balances
| Reference period | Inventories seasonally adj. data |
Inventories raw data |
Employment seasonally adj. data |
Employment raw data |
Expectations on economic situation seasonally adj. data |
Expectations on economic situation raw data |
| August-12 | -1 | -5 | -6 | -10 | -37 | -37 |
| September-12 | -5 | -6 | -3 | 0 | -36 | -37 |
| October-12 | 2 | 0 | -11 | -11 | -41 | -40 |
| November-12 | -2 | 0 | -2 | -2 | -45 | -45 |
Contact us
For further information please contact the Research Department tel. +390258370.328/409, e-mail stud@assolombarda.it.
Non sei associato e ti servono informazioni?
ContattaciAzioni sul documento

